
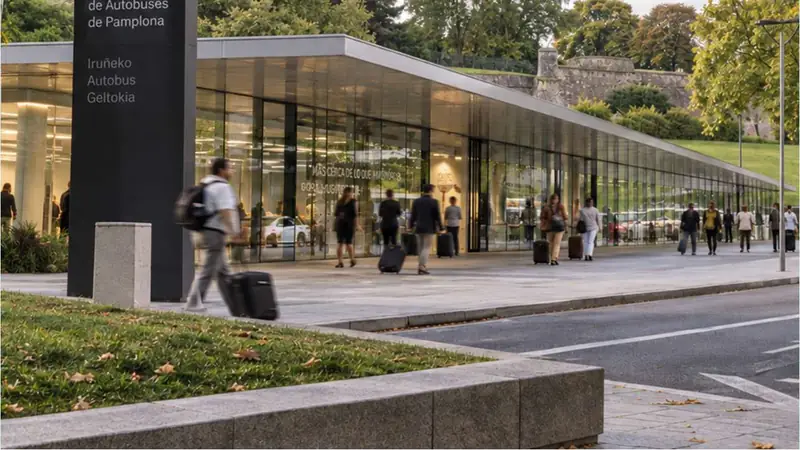
Advertising at Pamplona Bus Station Pamplona
Pamplona Bus Station · Inland city
Pamplona Bus Station
Next to the Citadel and beneath 35,000 m² of green space, it has a glazed entrance and connections to city buses. Its central location puts it beside the shopping district and a few minutes from the old town.
- 2Mpassengers a year
- 147Kpassengers during San Fermín
- 100regional, national and international destinations
In the Interactive network
Monthly APPcelerate measurement (November 2025) at the station’s sites.
Population: 203,081 · frequency 6 · TRP 318
Who passes through the station
Measurement point: Station entrance. Underground station next to the Citadel, right in the centre: regional, long-distance and Camino de Santiago connections.
Pamplona
- Users210,011
- Geo users115,540
- Impressions1,174,403
- Geo impressions646,112
- Average frequency5.6
Time of day
People by time slot and footfall through the day
Peak hours: 08:00 · 14:00 · 18:00
Bar height: relative footfall in that hour.
Presence
210,011 people · out of every 100, how many are in each situation
- Frequent6%
- Home5%
- Work1%
- Occasional0%
Gender
Clearly more women, as is usual among intercity bus passengers.
Age
Years
Socio-economic level
% of the audience
Affinities
Index 100 = population average. To the right, higher affinity than average.
- 1Low-cost travel165
- Education and jobs150
- Fast food148
- Digital entertainment145
- Affordable fashion and footwear133
- Black Friday122
In short
In November 2025, the measured site in Pamplona totalled 1,174,403 impressions and 210,011 unique users. 210,011 people pass the measurement point: 88% are in transit, 64.19% are women and the peak hours are 08:00, 14:00 and 18:00. The highest-affinity category is low-cost travel (index 165), and in the municipality the network reaches 56.89% of the population in a month.
View the data as a table
| Indicator | Value |
|---|---|
| Users | 210,011 |
| Geo users | 115,540 |
| Impressions | 1,174,403 |
| Geo impressions | 646,112 |
| Average frequency | 5.6 |
| Residents | 55% |
| Visitors | 45% |
| Home | 5% |
| Frequent | 6% |
| Occasional | 0% |
| Work | 1% |
| Transit | 88% |
| Men | 35.81% |
| Women | 64.19% |
| 00:00–07:59 | 15% |
| 08:00–13:59 | 31% |
| 14:00–20:59 | 40% |
| 21:00–23:59 | 14% |
| Age 18–25 | 23% |
| Age 25–45 | 32% |
| Age 45–65 | 34% |
| Age 65+ | 11% |
| Socio-economic level: Low | 0% |
| Socio-economic level: Lower-middle | 1% |
| Socio-economic level: Middle | 34% |
| Socio-economic level: Upper-middle | 45% |
| Socio-economic level: High | 20% |
| Affinity index: Low-cost travel | 165 |
| Affinity index: Education and jobs | 150 |
| Affinity index: Fast food | 148 |
| Affinity index: Digital entertainment | 145 |
| Affinity index: Affordable fashion and footwear | 133 |
| Affinity index: Black Friday | 122 |
Source: APPcelerate · data for November 2025.
Sites available in Pamplona
Sites and activations you can book at the station. We help you combine them to suit your campaign.
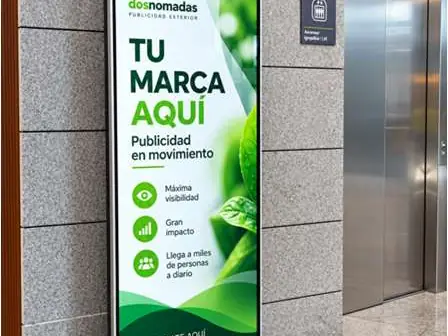
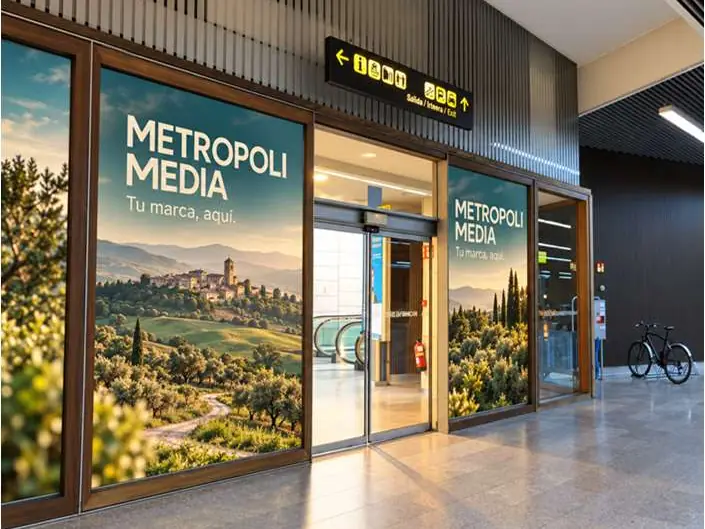
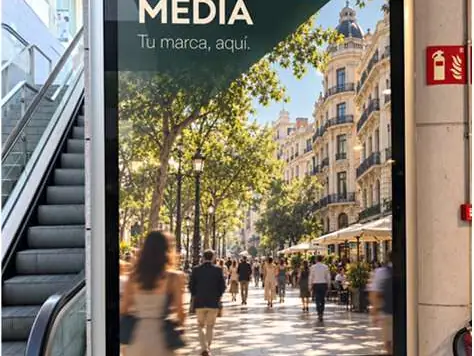
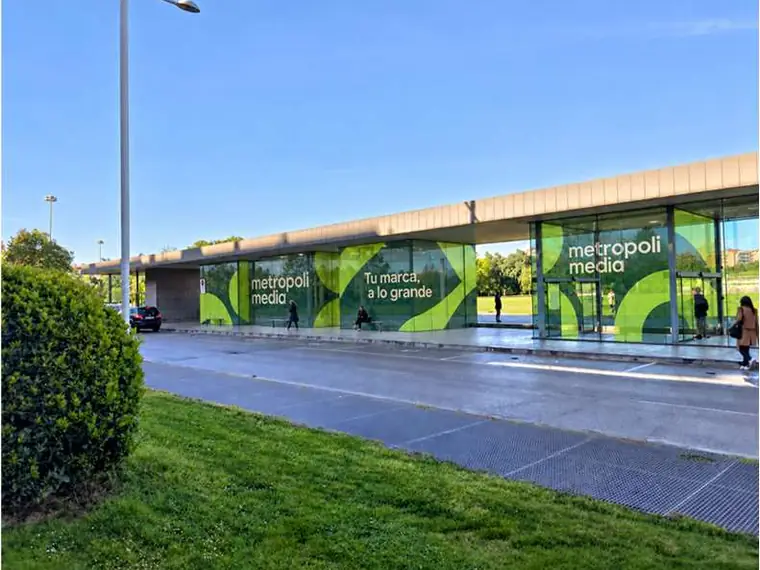
Some images are AI-generated simulations.
Shall we talk about your next campaign?
Tell us what you need and we will suggest the sites and formats that best connect your brand with your audience.