

Bus station advertising audience Who passes through the network
Interactive network audience measured by APPcelerate in November 2025: how many people, who they are, when they pass and what they are interested in.
The network in figures
In the 11 target areas
In the municipalities where the stations are, the network reaches almost 7 in 10 people in a month.
Universe: 6,247,077 people in the target areas.
Source: APPcelerate · data for November 2025.
Explore the 11 stations
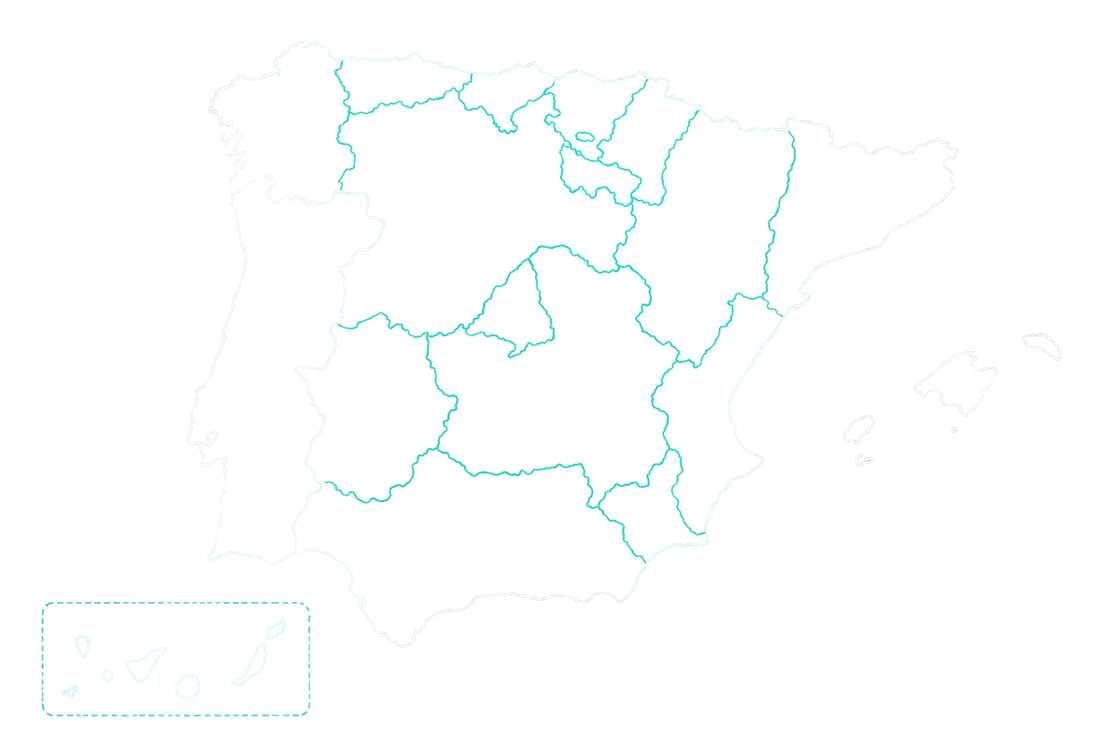
Choose a station on the map or in the list to see its monthly audience. Each circle’s size shows its monthly impressions.
Madrid
Méndez Álvaro transport hub
Monthly impressions and unique users by station
View the data as a table
| Station | Setting | Sites measured | Unique users a month | Impressions a month |
|---|---|---|---|---|
| Madrid | Several spaces | 4 | 4,481,787 | 10,446,869 |
| Seville | Regional hub | 2 | 971,352 | 4,412,518 |
| Zaragoza | Bus + high-speed rail hub | 2 | 500,080 | 1,221,778 |
| Palma de Mallorca | Coastal destination | 1 | 277,136 | 3,539,743 |
| Alicante | Coastal destination | 2 | 298,472 | 1,743,970 |
| Córdoba | Inland city | 1 | 328,151 | 1,710,466 |
| Pamplona | Inland city | 1 | 210,011 | 1,174,403 |
| Santander | Coastal destination | 1 | 68,987 | 1,229,623 |
| Ávila | Inland city | 1 | 70,077 | 649,198 |
| Teruel | Inland city | 1 | 40,988 | 406,018 |
| Santa Pola | Coastal destination | 1 | 66,063 | 426,055 |
Source: APPcelerate · data for November 2025.
Who they are and when they pass
Presence, gender, age, socio-economic level and timing of the people who pass the network’s sites.
Presence
4,363,181 people · out of every 100, how many are in each situation
- Frequent5%
- Home2%
- Work1%
- Occasional0%
Gender
Slightly more women, as is usual among intercity bus passengers.
Age
Years
Time of day
People by time slot
Block width: length of the time slot. Area: % of people.
Socio-economic level
% of the audience
View the data as a table
| Indicator | Value |
|---|---|
| Home | 2% |
| Frequent | 5% |
| Occasional | 0% |
| Work | 1% |
| Transit | 92% |
| Men | 45.38% |
| Women | 54.62% |
| Age 18–25 | 23% |
| Age 25–45 | 34% |
| Age 45–65 | 32% |
| Age 65+ | 11% |
| Socio-economic level: Low | 0% |
| Socio-economic level: Lower-middle | 32% |
| Socio-economic level: Middle | 26% |
| Socio-economic level: Upper-middle | 22% |
| Socio-economic level: High | 20% |
| 00:00–07:59 | 22% |
| 08:00–13:59 | 29% |
| 14:00–20:59 | 39% |
| 21:00–23:59 | 10% |
Source: APPcelerate · data for November 2025.
Coverage in each city
The share of each municipality’s population that sees the campaign in a month, with its frequency and advertising pressure (TRP). Target: the whole population.
- National9.21%433
- Target areas68.79%4258
- Madrid81.97%2191
- Teruel80.35%10796
- Santa Pola79.69%6514
- Córdoba78.64%5410
- Ávila72.52%9672
- Pamplona56.89%6318
- Seville54.01%5245
- Palma de Mallorca50.79%13649
- Zaragoza50.21%2123
- Alicante44.19%6258
- Santander29.23%18521
View the data as a table
| Area | Municipal population | Users | Impressions | Reach | Frequency | TRP |
|---|---|---|---|---|---|---|
| National | 47,367,051 | 7,313,103 | 26,009,503 | 9.21% | 4 | 33 |
| Target areas | 6,247,077 | 4,297,604 | 16,121,149 | 68.79% | 4 | 258 |
| Madrid | 3,305,408 | 2,709,600 | 6,308,039 | 81.97% | 2 | 191 |
| Seville | 684,234 | 369,585 | 1,678,589 | 54.01% | 5 | 245 |
| Zaragoza | 675,301 | 339,058 | 828,374 | 50.21% | 2 | 123 |
| Palma de Mallorca | 419,366 | 212,989 | 2,720,419 | 50.79% | 13 | 649 |
| Alicante | 337,304 | 149,058 | 870,949 | 44.19% | 6 | 258 |
| Córdoba | 322,071 | 253,284 | 1,320,223 | 78.64% | 5 | 410 |
| Pamplona | 203,081 | 115,540 | 646,112 | 56.89% | 6 | 318 |
| Santander | 172,221 | 50,334 | 897,151 | 29.23% | 18 | 521 |
| Ávila | 57,949 | 42,024 | 389,316 | 72.52% | 9 | 672 |
| Teruel | 35,994 | 28,921 | 286,485 | 80.35% | 10 | 796 |
| Santa Pola | 34,148 | 27,211 | 175,492 | 79.69% | 6 | 514 |
Source: APPcelerate · geographic level: municipality · period: November 2025 · target: all genders, incomes and ages.
What resonates with this audience
The categories that resonate most with people passing through bus stations and transport hubs, compared with the population average.
Network affinity index
Index 100 = population average. To the right, higher affinity than average.
- 1Low-cost travel and public transport186
- 2Fast food and convenience157
- 3Education, university and jobs152
- 4Digital entertainment: streaming, music and gaming152
- 5Prepaid mobile and low-cost plans141
- Affordable fashion and footwear136
- Supermarkets and value brands132
- Second-hand and marketplaces131
- Black Friday and consumer electronics129
- Everyday finance and money transfers127
- Lotteries and prize draws114
- Tourism and leisure at destination106
- Health, pharmacy and opticians106
- Automotive75
- Investment banking and premium insurance62
- Luxury and premium53
View the data as a table
| Category | Index (100 = average) |
|---|---|
| Low-cost travel and public transport | 186 |
| Fast food and convenience | 157 |
| Education, university and jobs | 152 |
| Digital entertainment: streaming, music and gaming | 152 |
| Prepaid mobile and low-cost plans | 141 |
| Affordable fashion and footwear | 136 |
| Supermarkets and value brands | 132 |
| Second-hand and marketplaces | 131 |
| Black Friday and consumer electronics | 129 |
| Everyday finance and money transfers | 127 |
| Lotteries and prize draws | 114 |
| Tourism and leisure at destination | 106 |
| Health, pharmacy and opticians | 106 |
| Automotive | 75 |
| Investment banking and premium insurance | 62 |
| Luxury and premium | 53 |
Consumer profile
A young, price-conscious audience on the move, who choose public transport and make buying decisions on their phones while they wait and travel.
- Middle and lower-middle socio-economic level58%
- Aged 18 to 4557%
- Women54.62%
- Passing through the station92%
Highest-affinity categories
- Low-cost travel and public transport
- Fast food and convenience
- Education, university and jobs
- Digital entertainment: streaming, music and gaming
- Prepaid mobile and low-cost plans
Source: APPcelerate · data for November 2025.
What people ask most about the network
What is Metrópoli Media?
Metrópoli Media (Metrópoli Media 2025 SL) is a Spanish out-of-home advertising company. Under exclusive contracts and concessions, it sells advertising space in bus stations and transport hubs (the Interactive network) and outdoor and indoor digital screens (DOOH).
Which stations are in the Interactive network?
In 11 bus stations and transport hubs in Spain: Méndez Álvaro (Madrid), Plaza de Armas (Seville), Zaragoza Delicias, Palma Intermodal Station (Mallorca), Alicante, Córdoba, Pamplona, Santander, Ávila, Teruel and Santa Pola. In total, 218 advertising sites.
How many people see the network’s advertising?
According to APPcelerate’s November 2025 measurement, the Interactive network reaches 7,313,103 unique users and generates 26,009,503 impressions a month (frequency 4, TRP 33). Its stations handle 238,000 passengers a day and more than 70 million a year, connected with over 4,000 destinations.
What reach does it have in the cities where the stations are?
In the 11 target areas (6,247,077 people) the network reaches 68.79% of the population in a month: 4,297,604 unique users and 16,121,149 impressions, with frequency 4 and TRP 258. The cities with the highest reach are Madrid (81.97%), Teruel (80.35%) and Santa Pola (79.69%).
What is the audience profile?
A young, price-conscious audience on the move: 92% are passing through the station, 54.62% are women, 57% are aged 18 to 45 and 58% are of middle or lower-middle socio-economic level. The busiest time slot is 14:00 to 20:59 (39% of people).
Which categories resonate most with this audience?
Compared with the population average (index 100), the top categories are low-cost travel and public transport (186), fast food and convenience (157), education, university and jobs (152), digital entertainment (152) and prepaid mobile and low-cost plans (141).
Which station has the largest audience?
Madrid’s Méndez Álvaro transport hub: its 4 measured sites total 10,446,869 impressions and 4,481,787 unique users a month. It is followed by Seville Plaza de Armas (4,412,518 impressions) and Palma Intermodal Station (3,539,743 impressions).
Which advertising formats are available?
Digital sites, street furniture panels (mupis), vinyl takeovers, XXL banners and spectacular marketing activations, plus stands and street marketing. Each station has its own formats, such as the 160 m² outdoor banner at Méndez Álvaro or the 20 × 6 m XXL banners in Zaragoza’s AVE area.
What does Metrópoli Media offer in digital out-of-home (DOOH)?
Digital screens supporting national and local campaigns, retargeting and programmatic advertising: Digital Barcelona (3 screens in the Eixample), Digital Zaragoza (15 sites on Avenida de la Independencia, 491,178 impressions a week), exclusive digital mupis and LED screens in the stations, and the DLS network with more than 650 screens in 35 provinces and 72 million impressions a week (source: Geomex 4.0).
Where does the audience data come from?
Station data comes from APPcelerate (period 1–30 November 2025, municipal level, target: the whole population). DOOH data comes from Geomex 4.0.
How do I book a campaign?
Email info@metropolimedia.es or use the contact form on the website. Metrópoli Media prepares a proposal of sites and formats tailored to each campaign.
Shall we talk about your next campaign?
Tell us what you need and we will suggest the sites and formats that best connect your brand with your audience.